6 Graphs That You Need to Know about the Fintech Market Landscape in Africa
02 June 2023•
%2Fuploads%2Ffintech-africa%2Farticles%2F6-graphs%2Fcover.jpg&w=3840&q=75)
Fintech Dominance in Africa
Fintech is the dominant sub-sector in Africa’s technology sector, both in terms of the number of startups and scaleups formed, as well as the amount of investment raised. According to a report by Disrupt Africa, fintech accounted for 31.4% of all African tech startups in 2020, making it the largest sector by far. Lucidity Insights research found that in 2020, that number is largely unchanged amongst scaleups – with 30% of all African scaleups who have fundraised over US $1 million, representing the fintech industry. The dominance is expected to continue, with the potential for fintech to drive financial inclusion and economic growth across the continent.
In this article, explore the 6 essential graphs revealing the state of the fintech market landscape in Africa.
1. Nigeria is the dominant fintech market in Africa.
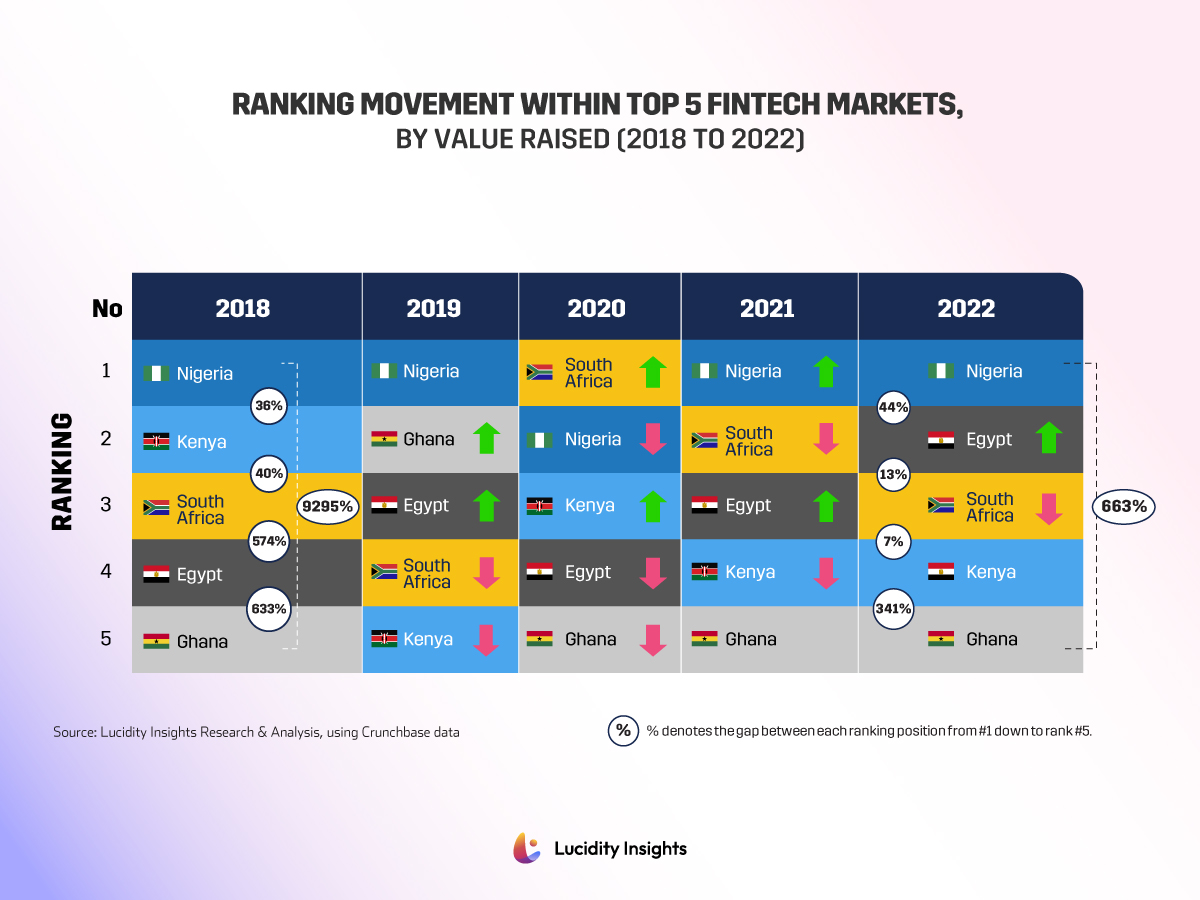
Infographic: Ranking Movement within Top 5 Fintech Markets, by Value Raised (2018 to 2022)
When looking at the Top 5 ranking markets in terms of Fintech startup activity (by value of VC funds raised) for the past 5 years, we see Nigeria consistently on top. Nigeria with its 213 million population, 60 million unbanked population, and its $440 billion GDP economy that is Africa’s largest economy – roughly equivalent to the economy of Austria, is the dominant fintech market in Africa.
The top 4 markets for Fintech fundraising are Nigeria, Egypt, South Africa and Kenya, with Nigeria dominating in 2022, raising 44% more than 2nd place Egypt. Egypt, South Africa and Kenya are fighting a relatively tight race for 2nd, 3rd and 4th place, while 5th place Ghana is starting to close the gap, but is still considered a laggard having fundraised 341% less than 4th place Kenya. That said, in comparison to 2018, the growth over the past 5 years has been substantial. The data shows that the gap between 1st place Nigeria and the rest of the top 5 countries continues to close year after year, while all countries show fundraising growth. This means that more African markets are joining in the Fintech Ecosystem and raising capital.
Related: The future of fintech may well be in Africa.
2. Fintech funding constitutes a significant portion of the VC funding going into Africa.
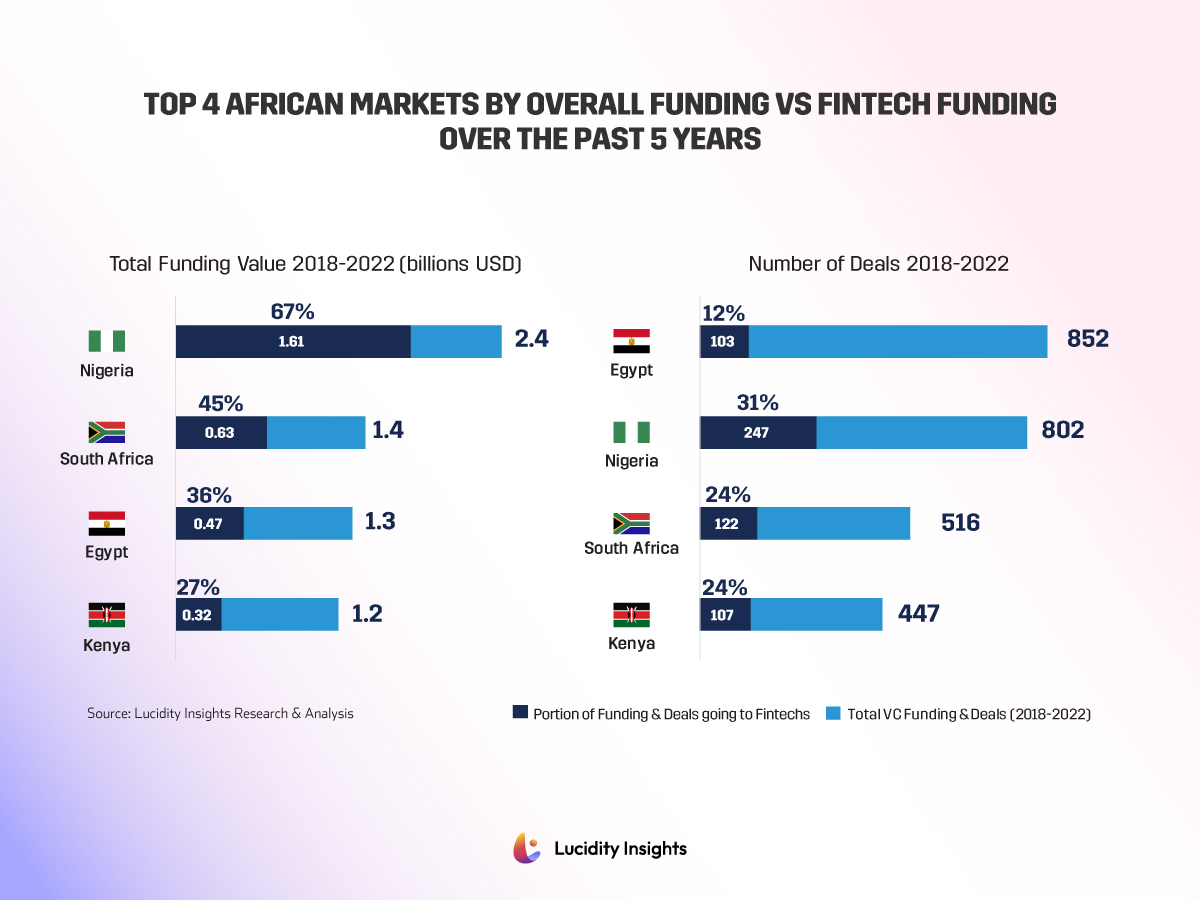
Infographic: Top 4 African Markets by Overall Funding vs Fintech Funding Over the past 5 Years
For Nigeria, the largest and fastest growing tech and fintech market in Africa, 67% of all VC funding in the past 5 years went to Fintech startups. Nearly half (45%) of all VC funding in the past 5 years in South Africa went to Fintechs, and in Egypt, it is just over 1/3rd. Egypt had the most number of VC deals inked in the past 5 years, though only 12% of these were inked with fintechs. This tells us that Egyptian fintechs have the largest funding rounds.
3. Nigeria, South Africa and Egypt dominate Fintech in Africa, but each tell a different story.
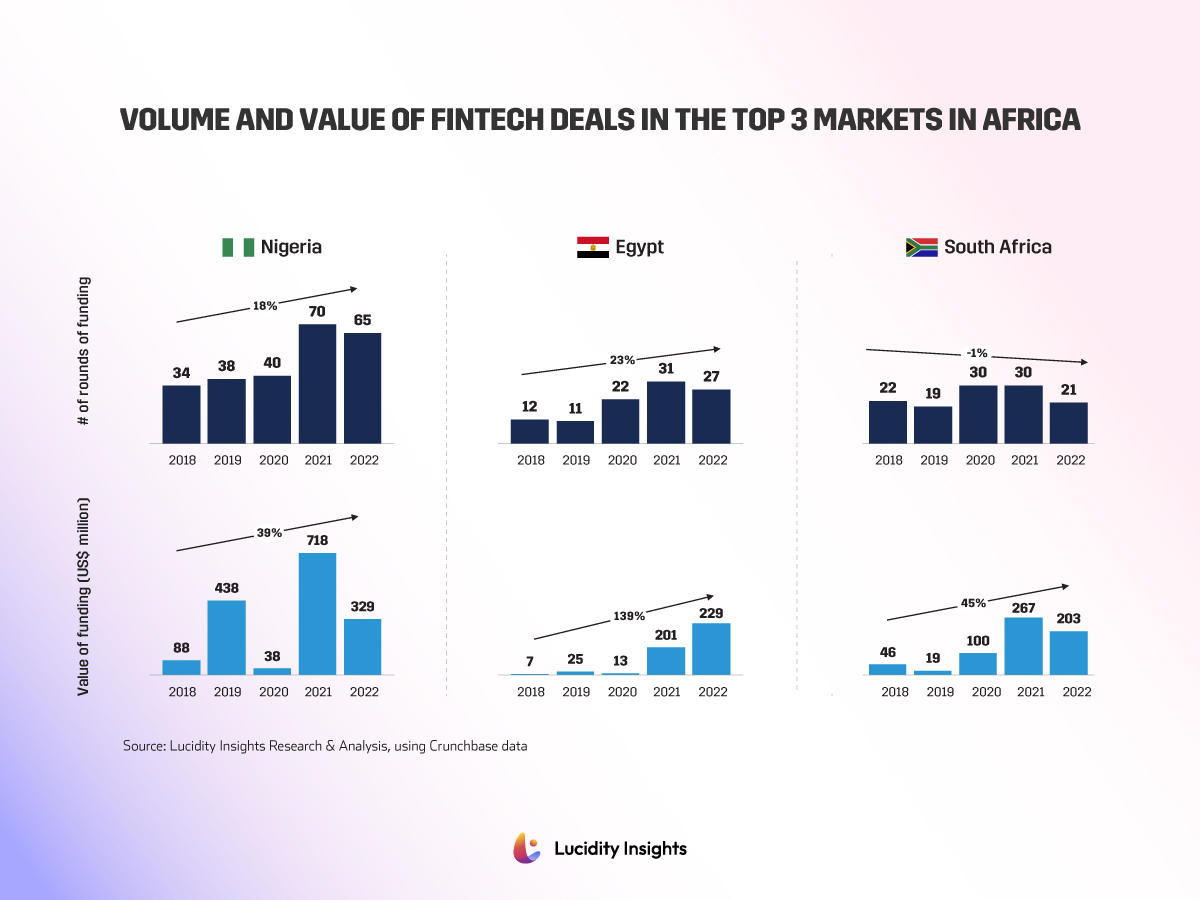
Infographic: Volume and Value of Fintech Deals in the Top 3 Markets in Africa
Nigeria dominates in both the number of startup deals getting inked as well as the amount of funding raised. Nigeria’s fintech fundraising has grown by 39% on average, year on year, across the past 5 years. The trend is upwards, though Nigeria tends to have large years, followed by a decline in fundraising, only to break records again and repeat the yo-yo effect.
Though South African fintechs have raised more capital than Egyptian fintechs over the past 5 years, Egyptian fintechs raised more capital in 2022, and have grown 139% CAGR since 2018. In contrast, South Africa has only grown fundraising 45% on average across the same time period. If trends continue, Egypt could well cement its 2nd place positioning over South Africa in 2023.

4. Fintech Deal Sizes have grown across the board over the past 5 years.
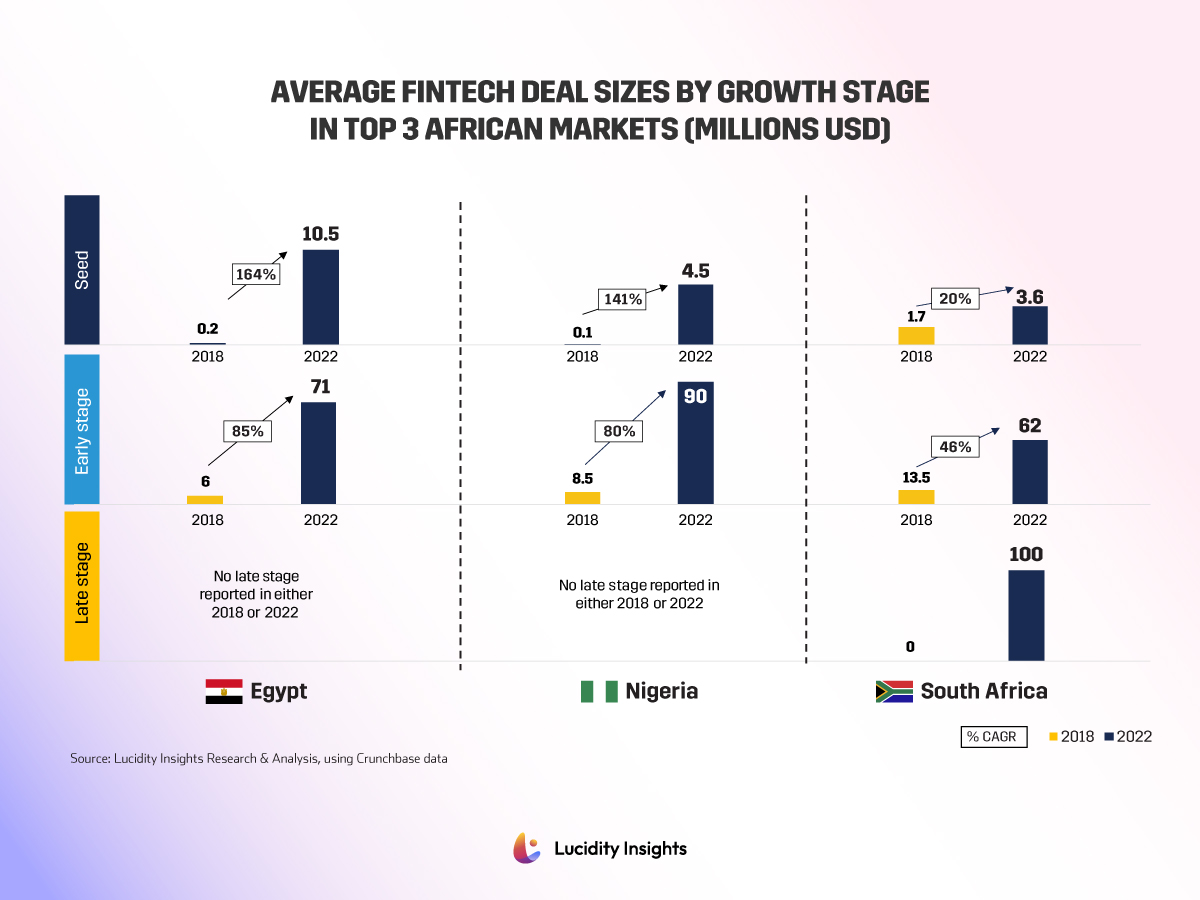
Infographic: Average Fintech Deal Sizes by Growth Stage in Top 3 African Markets (Millions USD)
In the top 3 markets, average Seed cheque sizes have grown the most and are largest in Egypt, reaching $10.5M. The average seed cheque size for Nigerian startups in 2022 was less than half of an Egyptian seed, at $4.5 million. Average Early Stage cheques are highest in Nigeria, at $90 million. Though both Egypt and Nigeria are home to fintech unicorns, only South Africa has started to see enough maturity to write late stage fintech cheques in 2022, which averaged $100M.
5. Just getting started: Seed & Early Stage Fintech Investments Dominate.
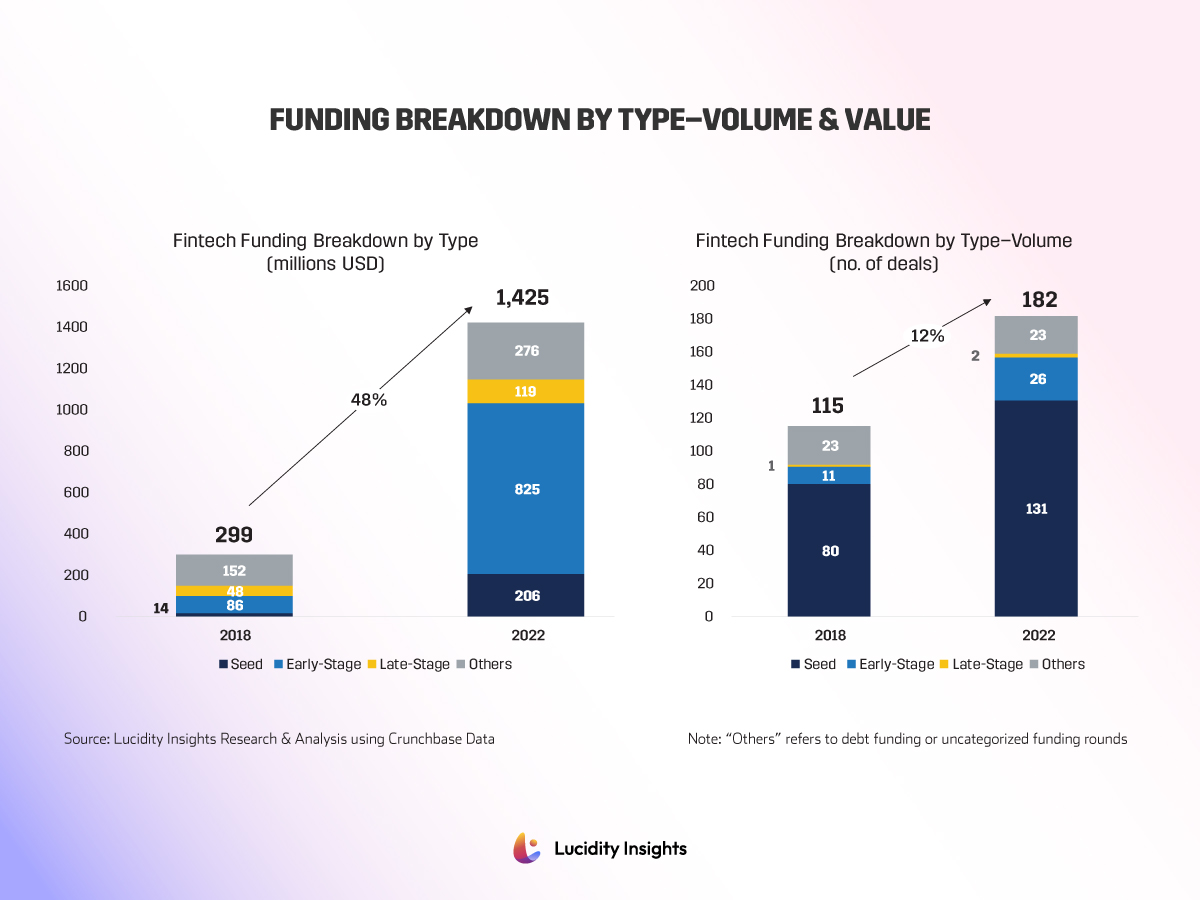
Infographic: Funding Breakdown by Type–Volume & Value
Seed and Early stage investments make up 72% of total fintech funds raised in 2022, and 86% of all deals inked in 2022 were with seed and early-stage fintech startups.
6. Payments and Wallets are the fastest growing products in Africa.
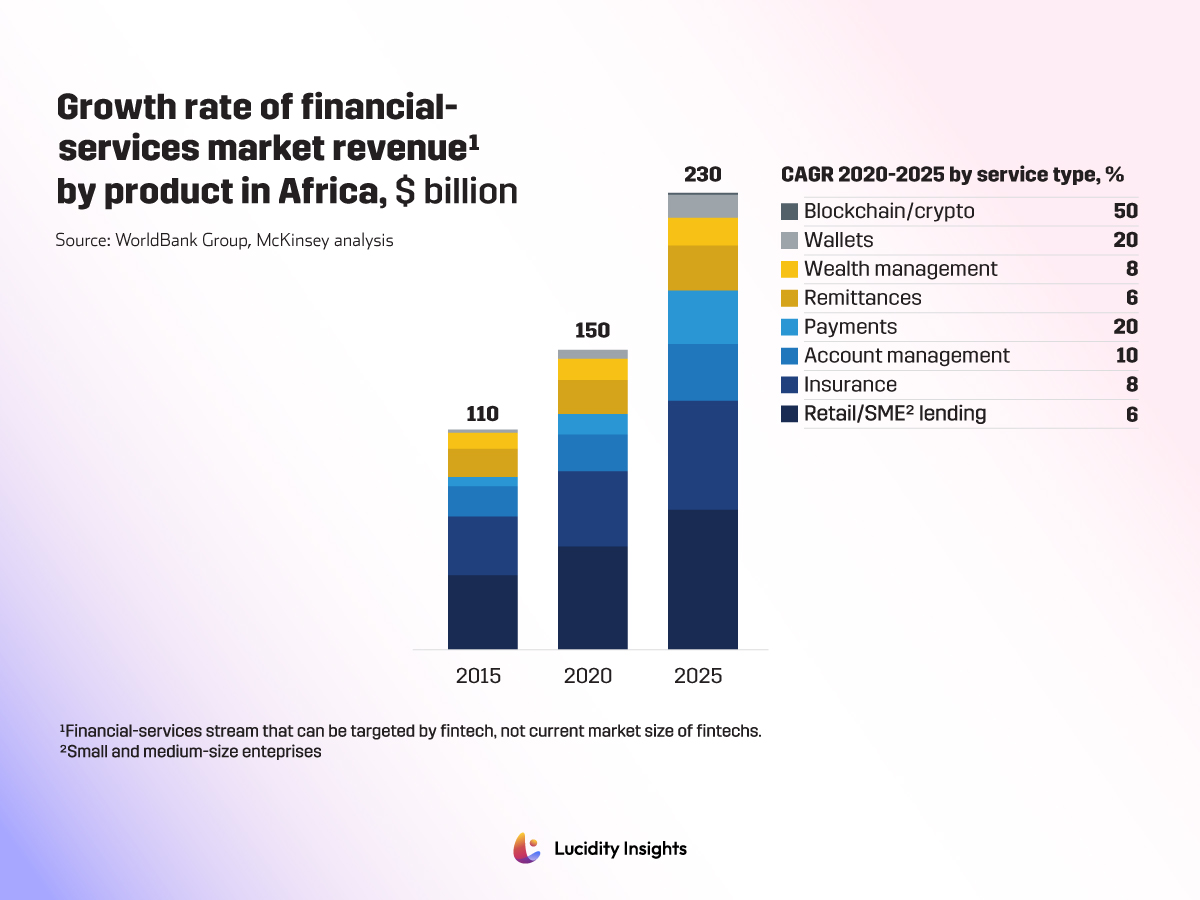
Infographic: Growth Rate of Financial Services Market Revenue by Product in Africa, $ Billion
Financial Services revenues in Africa are expected to grow by 10% per year until 2025, with payments and wallets being the fastest growing products.
Next Read: Here Are the 10 Graphs That Will Help Explain the Fintech Opportunity and Challenge in Africa

%2Fuploads%2Ffintech-africa%2Fcover13.jpg&w=3840&q=75)